
The time it takes to load a web page is called the page download speed, or load time. Your site’s average load time is an important factor in Google’s site ranking algorithm. Web users expect pages to load quickly, and pages with longer load times tend to have higher bounce rates, and those sites are seen as less important. For more information on the effect of site performance and organic rankings and conversion, see Cloudflares article on Website Performance and Conversation Rates.
To measure site speed, Google released a SEO tool called Lighthouse back in 2018 that offers some insight on the performance of your website and its pages. This audit gives a mobile and desktop score across four areas: Performance, Accessibility, Best Practices, and SEO. For the sake of this article, we will be focusing on solely the “Performance” category of the testing and its associated fixes. So, let’s dive in!
Performance
This area is scoring based on factors such as:
- How long it takes your webpage to first “begin” loading. This is known as the “first contentful paint” or “first meaningful paint”. This is usually based solely on the server and it’s performance, we will ignore this metric in this post since we can’t do anything about it in Site Builder.
- How many render-blocking elements such as scripts, fonts, etc. are in the head and must finish loading before the browser can start to draw the page.
- Are your javascript and other resources “minified” and compressed?
- Do you defer “offscreen images”? Also called “lazy loading”
- Do you serve properly sizes images? Are they properly compressed?
What Can We Do?
Call a web development professional! In all seriousness, you will need to, but lets go over some things in the meantime.
Header and Footer: Common Files/Scripts
We recently optimized the Site Builder site www.OhMyArthritis.com and will explain our process using it as an example. When we examined the common scripts, we found them to be dispersed throughout the header and footer. Remember that each separate request in the <head> to a script or file is going to add to our “render-blocking” scripts, and thus increase page load time.
To alleviate this and increase our improvements in lighthouse performance score, we needed to:
- LOAD. All of our libraries for our fonts, jQuery version, and other scripts locally rather than from an external URL
- COMBINE. There were 6-7 separate javascript files being loaded, we combined them all into one, which reduces the number of requests going over the network. While combining, we were able to eliminate multiple function and event listeners which also improves page scores.
- PRELOAD. By appending a special attribute to our javascript and style files, we can preload them from the head, which is not render-blocking, and then load them again after the entire page has loaded.
- MINIFY. All of the pre-existing javascript was not production ready as it was not minified. We ran all javascript libraries and common functions through a minification library which helps with browser render times and decreases page/file sizes.
Lazy Loading Images “Below The Fold”
There are a few ways to lazy load images when they become in view. One way is to use the new built-in native browser support (supported by modern versions of IE Edge, FireFox, Chrome, and Opera), the other two involve javascript libraries such as loZad and the intersection observer API. We opted for a hybrid approach using both the built-in browser support, and a fallback javascript library.
If lazy loading is not supported or recognized in the browser, then a javascript library (in this case LazySizes) takes care of it using regular JavaScript.
Image Optimization
To optimize our images and save on overall page load size, which is the biggest factor in speed and performance of a web page, we needed to:
- Download all of the images use on our website
- Process these through an image optimization library which, on average, saves anywhere from 25-45% of image file size (depending on what compression already existed)
- Ensure no loss to visual quality and re-upload
Our entire image folder ended up being compressed by a total of 30%, and we ended up saving ~82mb off our total image folder size! Mark that up in the win column.
Results
One interesting I noticed while auditing using the Lighthouse performance tool, was that it was all over the board in terms of numbers. This made it difficult to focus on the metrics we can control. First paint and other server-response times ranged from 6s to 43s during testing. To alleviate an unsatisfying / inaccurate report on our performance work, I took 3 tests before (for mobile and desktop) and after our upgrades mentioned above. This gave us a good mean, average score.
We wanted to test a set of pages that would cover all features that exist on the site. To accomplish this we chose to test:
- The Homepage
- A Category Page
- Two Product Pages
- A Content Page
Before
|
After
|
Improvement!
You can see there was a definite improvement across the board, we are happy! Don’t mind the size of the scores during testing, there are some scripts and other things that are causing other issues at the moment which is drastically bringing down the numbers.
You can see we took our render-blocking resources line item from in some cases taking 3s+ to an average of 0.84s!
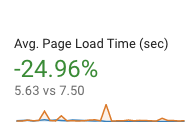
Average page load time across all pages, current vs previous month.
“Un-controllables”
- Third-Party Scripts: Facebook, Hotjar, Hubspot, Pinterest, Bing Ads, Tawk.to, analytics, etc. were contributing a half-second to the initial load time.
- Script Execution Time: LeadFlows, collectedforms.js, facebook, getsitecontrol.com were contributing about a second of execution time.
Conclusion
The entirety of what has been explained thus far is just scratching the surface on a 3-phase performance optimization project and there is much, much more that can be done. Over time, it’s only natural your website begins to accumulate a staggering amount of marketing tracking scripts (FB Pixel, lead forms, etc), javascript libraries, fonts, and other random additions to your templates by marketers, developers, and admins alike. Through this performance process it also doubles as a time to ask yourself “is this needed?”, performance is almost always clean.
Contact us for a Quote
We have become expert at getting the most out of Site Builder, and are happy to supply examples & references. Contact us for a quote to optimize your Site Builder site – the improvements will pay for themselves through better organic rankings and conversion rates!
More from Fourth Wave
 Netsuite Site Builder Responsive Conversion – Tips & Tricks
 Make Your NetSuite Site Builder Site Secure – HTTPS Throughout
 NetSuite Announces Plans to End Promotion Functionality for Site Builder
 Protect Your Online Forms from Bots & Spam
 What to know about schema.org and microdata tagging
 Most NetSuite Websites Are No Longer Tracking Safari Conversions for Adwords
Kevin Carpenter
Latest posts by Kevin Carpenter (see all)
- How to Increase eCommerce Revenue With Upsells and Cross-sells: Cart and Product Detail Page - September 8, 2020
- Netsuite 2020.2 Update: Data-center URL deprecation + What You Need To Know - August 8, 2020
- Site Builder Performance Upgrades - July 19, 2020
- Protect Your Online Forms from Bots & Spam - October 22, 2019
- What to know about schema.org and microdata tagging - May 2, 2019